Analytical Query Patterns That Destroy Postgres Performance
These four anti-patterns reveal why Postgres struggles with analytical queries designed for OLTP.

Postgres is built for OLTP: short transactions, quick lookups, frequent writes. The query patterns that cripple its performance do so because they fight that design, not because Postgres is poorly engineered or databases are fragile in general. A row-store keeps every column of a row together on the same disk page, so computing even a single-column sum means reading fields the query never asked for. Multi-Version Concurrency Control adds a second layer of friction: every UPDATE writes a new version of a row and leaves the old one behind marked dead, and a scan built for analysis has to step past those dead versions to find the live data, a cost that grows with every write the system takes in between. Analytical and transactional queries draw on the same CPU, RAM, and I/O, so a long scan can push the hot transactional working set out of the buffer cache and cause cache misses for the ordinary user-facing requests running alongside it. Teams often respond to slow analytical queries by adding indexes, which works until it doesn't: past a certain point, each new index adds write latency, because every INSERT or UPDATE now has to update that index too, synchronously, and the fix becomes its own cost. These four mechanics, row-store I/O amplification, MVCC bloat on scans, shared resource contention, and the index cliff, explain why each anti-pattern in this piece causes damage specific to Postgres's architecture.
SELECT * and its cost beyond network bytes
SELECT costs more than the bytes it pushes over the wire. The real damage is structural: it stops Postgres from using an index-only scan, one of the most effective optimizations available for read-heavy workloads. When every column a query needs is present in an index, Postgres can answer the query from the index alone and skip the heap. SELECT almost always defeats this, because an index rarely contains every column in a table, so the planner is forced to fetch each row from the heap regardless of how well-indexed the table is. This is why adding an INCLUDE clause to build a covering index does nothing if the query still asks for every column: the planner still has to visit the heap for whatever isn't stored in the index, and the covering index becomes dead weight. One well-known case: a team at a fast-growing startup traced a chunk of their database load back to SELECT queries that had quietly disabled index-only scan paths across their analytical workloads, turning what should have been cheap index reads into full heap scans at scale. Beyond the planner decision, there's the simple arithmetic of bytes read from the heap, bytes serialized for transport, and bytes deserialized on the client, all of which scale with table width and query frequency and add up fast on wide tables in hot code paths. The fix is to name the exact columns a query needs; doing so gives the planner the option of an index-only scan, lets it pick a narrower sort key, and cuts the payload size. SELECT still has a place: database-admin queries, dump scripts, and CTEs that genuinely consume every column are fine candidates. Production application code is not.
OFFSET pagination's cost as depth grows
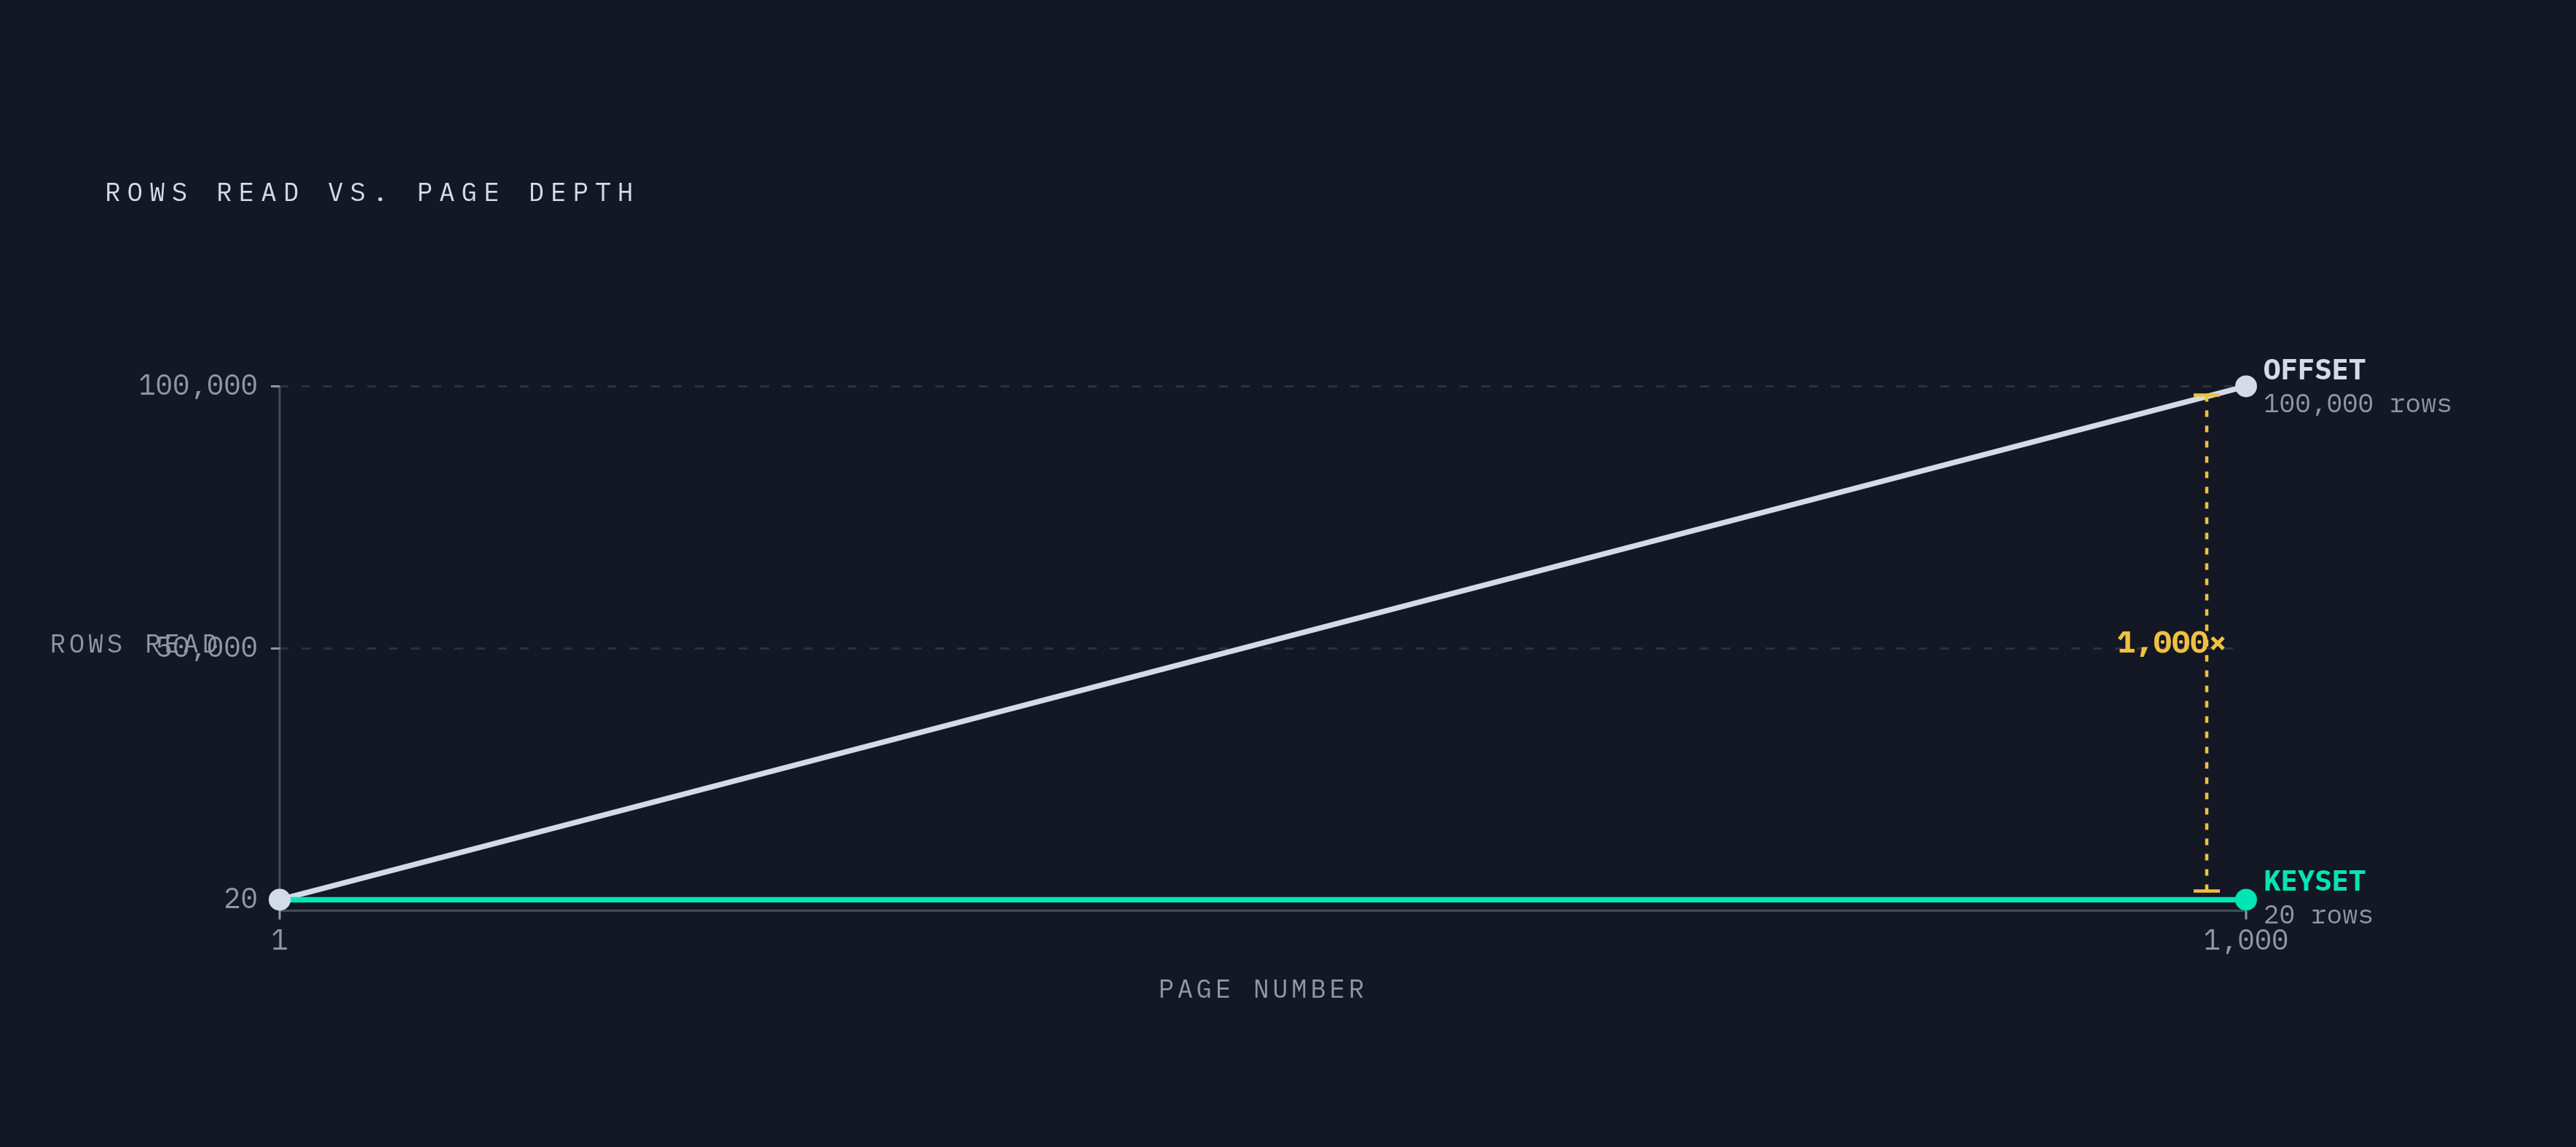
OFFSET pagination carries a cost that scales with how deep into the result set a query reaches. To return page 1,000, Postgres has to fetch and discard every row that came before it, which makes a deep page roughly a thousand times more expensive to retrieve than the first one. Postgres has no way to jump to an arbitrary row inside a heap. It reads sequentially from the start and throws away everything before the requested offset, so the offset value itself sets the amount of wasted work. This cost hides well in development and staging, where small tables make even a large OFFSET feel instantaneous. In production, against a table with millions of rows, that same query becomes a near-full sequential scan that discards almost everything it touches, and a pagination feature that felt fine in testing turns into a slow endpoint once real data volume arrives.
-- OFFSET pagination: cost grows with depth
SELECT * FROM orders ORDER BY id OFFSET 100000 LIMIT 20;

-- Keyset pagination: cost stays flat
SELECT * FROM orders WHERE id > 100000 ORDER BY id LIMIT 20;
Keyset pagination, sometimes called cursor pagination, replaces the offset with a WHERE clause anchored on the last row seen. Because that clause can be satisfied with an index seek, every page costs roughly the same regardless of how deep it sits in the result set. It isn't free of tradeoffs: it needs a stable, monotonic sort key, usually the primary key or a timestamp that only increases, and it doesn't support a UI pattern where a user jumps straight to page 47 without workarounds. For any interface built around "next" and "previous" rather than arbitrary page numbers, it is close to a pure upgrade.
NOT IN with nullable columns and the silent result-set collapse
NOT IN with a nullable column is a different kind of hazard. The previous two patterns slow a query down; this one can make it wrong, and the query gives no sign that anything is amiss. If the list or subquery on the right side of NOT IN contains even a single NULL, the entire expression returns zero rows, every time, regardless of what the rest of the data looks like. The mechanism traces back to SQL's three-valued logic: a comparison against NULL evaluates to UNKNOWN rather than FALSE, and NOT IN propagates that UNKNOWN across the whole condition, so no row can ever satisfy it. Postgres's planner has to evaluate that UNKNOWN condition against every row to behave correctly, so it often falls back to a sequential scan even with a usable index in place. The same query pays both a correctness penalty and a performance penalty at once. What makes this insidious is that the query runs cleanly and returns an empty result, and an application layer will frequently read that as "no matching rows exist" instead of recognizing a broken filter. The fix is to replace NOT IN with NOT EXISTS against a correlated subquery, which handles NULLs correctly by construction, or to add an explicit IS NOT NULL filter inside the subquery so the behavior stays predictable. EXISTS carries a secondary advantage: it returns true the moment it finds one matching row and stops checking, so it can outperform NOT IN in some cases, though modern query optimizers often arrive at equivalent plans once no NULLs are involved.
N+1 query loops disguised as application code
N+1 queries move the problem out of the SQL file and into the application layer. They survive so many code reviews as a result. The pattern itself is simple: one query fetches a list, and then one additional query runs per row to pull related data, so what should be two database calls becomes thousands of sequential ones as the result set grows. ORMs are the usual source, because lazy-loading is the default behavior in many of them: touching a relationship property on an object triggers a fresh query behind the scenes, with no SQL visible anywhere in the application code to flag it. The cost isn't query complexity; it's the accumulation of round trips. Each of those thousands of extra queries carries its own network round trip and its own plan-and-execute cycle, and on a result set numbering in the thousands, that overhead dominates total response time. The fix is a single JOIN that retrieves parent and child rows together in one pass, letting Postgres choose whichever join strategy fits, a hash join, a merge join, or a nested loop, and leaving the application to group the flat result set back into its parent-child shape. Most ORMs offer a direct equivalent for this: SQLAlchemy's joinedload(), ActiveRecord's.includes(:items), Django's select_related() and prefetch_related(), each described in their respective frameworks' own documentation as the standard way to eager-load associations and avoid exactly this problem. The pattern is invisible in a single query's EXPLAIN output, since each query in the loop looks fine in isolation. A burst of near-identical statements with incrementing IDs in application query logs, or a query-count metric that climbs in a straight line as the result set grows, reveals it instead.
Unindexed aggregations, implicit type casts, and functions on indexed columns
Three separate-looking patterns share one root cause: the planner can't use an index whose stored key doesn't match the expression the query is actually evaluating. That single mechanism explains most cases where a developer stares at an existing index and can't understand why Postgres refuses to use it.
Unindexed aggregations show up when GROUP BY or ORDER BY runs against a large column with no supporting index, forcing Postgres to sort or hash the entire result set in memory, and to spill to disk once that working set exceeds work_mem. Teams running analytical filters across shifting combinations of columns, region, time window, SKU, user segment, often respond by building a composite index for every permutation, which only accelerates the climb toward the index cliff described earlier, since each one adds write overhead on every INSERT and UPDATE. The better approach is to find the filter with the highest selectivity and index that column first, then reach for a partial index (WHERE status = 'pending') when a query reliably filters on a narrow, low-cardinality slice of the data.
Implicit type casts produce a different signature in EXPLAIN: a sequential scan appears even though an index exists on the filtered column, and the giveaway is a Filter: line where an Index Cond: line should be. The cause is usually a comparison between a text column and an integer literal, or the reverse, which forces Postgres to cast one side of the comparison, so the cast expression no longer matches what the index actually stores. This can reappear quietly after a schema migration, because changing a column from varchar to citext or to a custom domain type can shift which side of a comparison gets cast, so you should re-run EXPLAIN on key queries after any column type change rather than assume past performance still holds. The fix is to match the literal's type to the column's type in application code, or correct the column type if it was wrong to begin with.
Functions wrapped around indexed columns cause the same failure for a related reason. WHERE lower(email) = 'x' can't use a plain index on email, because the index stores the raw email values, not the output of lower(). Two fixes apply depending on the situation: normalize the data at write time, storing emails already lowercased or storing dates as dates instead of timestamps, or build an expression index that indexes the function's output directly, as in CREATE INDEX ON users (lower(email)). A related case is LIKE with a leading wildcard, as in LIKE '%wireless%', which forces a sequential scan because a standard B-tree index can't support substring matching that doesn't anchor to the start of the string. The fix there is the pg_trgm extension paired with a GIN index, which does support substring, ILIKE, and regex matching through the index rather than around it.
Reading EXPLAIN ANALYZE to confirm the fix worked
None of the fixes above mean anything until the query plan confirms them. EXPLAIN shows the planner's cost estimate before it runs anything, but EXPLAIN ANALYZE actually runs the query and reports real timing, real row counts, and real loop counts, and that gap between estimate and reality is where you find out whether the planner's assumptions matched the data. A few signals matter most, and they map directly onto the patterns covered above. A Seq Scan on a large table isn't automatically a problem (small tables and high-selectivity filters that return most of a table's rows are legitimate cases for one), but on a table running into the millions of rows, it's usually the sign that something upstream in this article is at play. A high count next to Rows Removed by Filter, especially paired with a Seq Scan, means the planner read a large number of rows just to throw them away, which points toward a missing or unusable index on the filtered column. If there's a wide gap between estimated and actual row counts, that points to stale statistics, so run ANALYZE to refresh them. When a plan node shows loops greater than one, remember that the actual time and row figures reported are per-loop averages, so the real total cost is that number multiplied by the loop count, a detail easy to misread as cheaper than it is. And the distinction between a Filter: line and an Index Cond: line matters directly: an Index Cond means the planner narrowed rows using the index before ever touching the heap, while a Filter line means it fetched rows first and discarded them afterward, the exact signature left behind by both the implicit-cast and function-on-column patterns. Beyond reading individual plans, pg_stat_statements helps direct the effort: sorting by total_exec_time rather than mean execution time surfaces the queries doing the most total damage across the system, and resetting stats after a fix lets the impact be measured cleanly rather than guessed at. One operational note belongs here too: building a new index with CREATE INDEX CONCURRENTLY avoids locking the table during the build, while skipping that keyword on a busy production table locks out writes for as long as the build takes. No query should be considered fixed until EXPLAIN ANALYZE says so.
Where Postgres query discipline ends and architectural limits begin
Everything covered so far, SELECT *, OFFSET depth, NOT IN with nulls, N+1 loops, unindexed aggregations, implicit casts, functions on indexed columns, is fixable through query discipline alone, and fixing them resolves the overwhelming majority of Postgres performance complaints that growth-stage teams run into. But there's a point past which no amount of query rewriting helps, because at that point the constraint is no longer the SQL but the row-store architecture itself. A team rewriting every query correctly, indexing precisely, and still watching analytical workloads degrade as data volume climbs is no longer looking at a bad query: it's looking at a row-store asked to do the job a column-store or a dedicated analytical engine is built for. Recognizing that boundary early matters, because the response to it is not another index or another rewrite but a decision about where analytical workloads should run, made before the team sinks more engineering time into squeezing a few more milliseconds out of a system that has already given up what query-level tuning can offer.