Operational Analytics on Postgres Without a Warehouse
Postgres can handle bounded operational analytics if you know its limits.
Operational analytics on Postgres without a warehouse works best when the analysis stays in Postgres and consumers read pre-calculated datasets. For Supabase SaaS teams seeking full API control without an opinionated frontend, a single metric definition layer can serve dashboards, applications, and AI agents through a governed API or MCP server. The central investment is consistent modeling.
Why treating Postgres as an extraction target costs more than it saves
Postgres runs the application, a warehouse runs the reports, and an ETL pipeline moves data between them. That separation imposes engineering work before it produces analytical value. Teams must keep the pipeline working and run another system, even when they just need answers about subscriptions, completed actions, or revenue already in Postgres.
Companies that are just starting out feel this cost most directly. The hours engineers spend keeping data moving leave less time to work on the product, while the system gets harder to run before it has the volume that was supposed to justify the split. The split is based on the partly true claim that Postgres struggles with analytics. Postgres’s struggles with analytics depend on the workload: bounded operational reporting and unrestricted analysis of billions of events make different demands.
What actually causes Postgres to slow down on analytical workloads
Postgres stores data in rows. A query aggregating one column from a wide table must read entire 8 KB pages containing other columns, increasing disk work beyond what a columnar engine requires. MotherDuck’s diagnostic guide describes this as I/O amplification. An index may reduce the search space, but it cannot make row-oriented storage behave like a columnstore when a query needs a broad scan.
Those scans also compete with the application for memory. Large analytical reads cycle data through the buffer cache, evicting hot transactional data and turning ordinary API requests into disk reads. Updates add more work because version-based concurrency control creates new tuples and leaves old versions dead. Analytical scans must read through the bloat that builds up to find live data, especially where data changes fast.
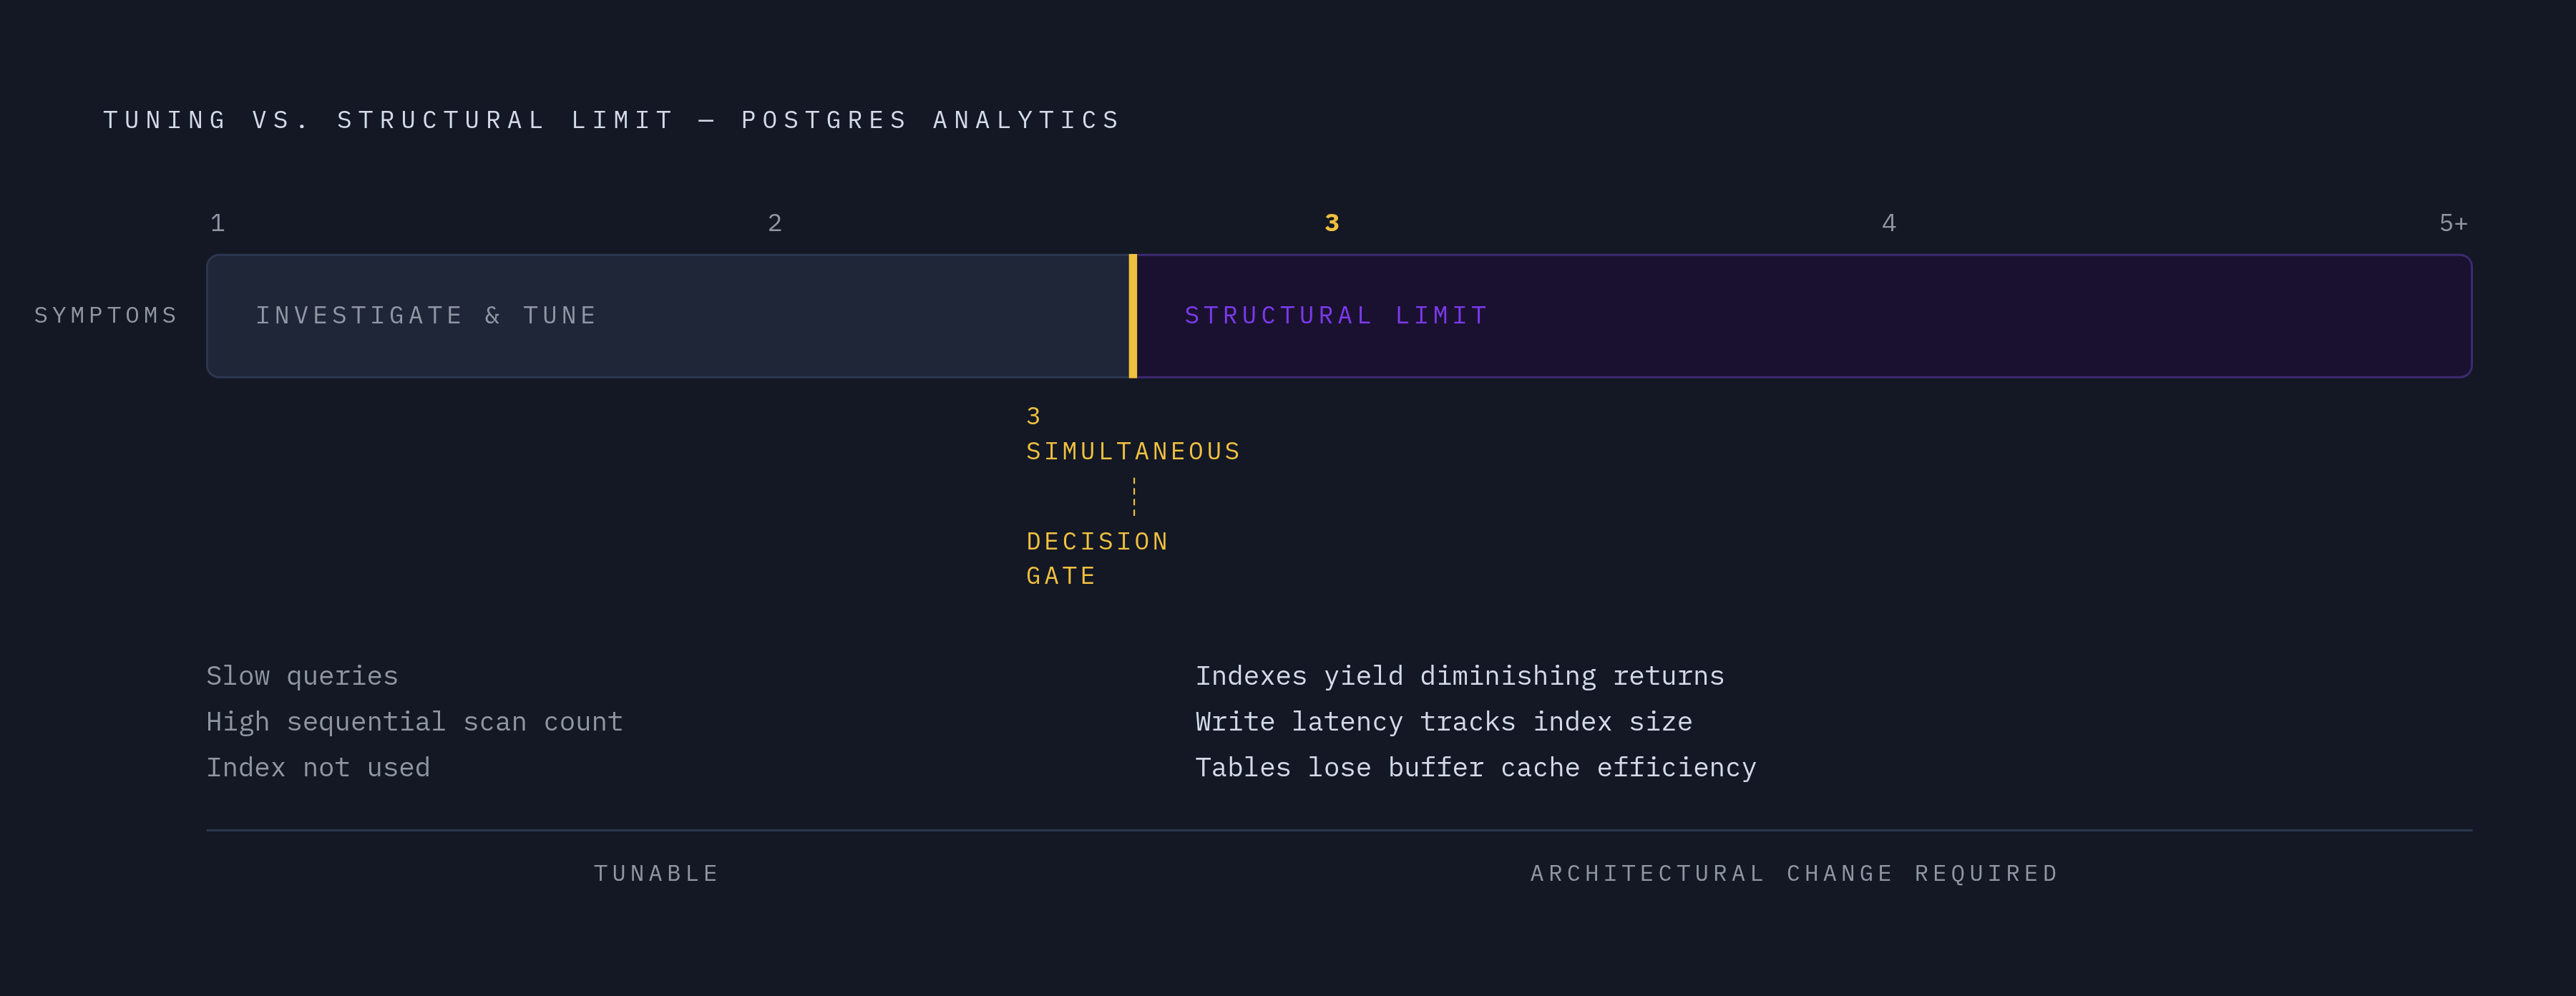
The combination distinguishes tuning trouble from architectural strain. The same guide treats one or two symptoms, such as slow queries and high sequential scan counts, as reasons to investigate optimization. Three or more simultaneous symptoms suggest a structural limit, particularly when indexes yield diminishing returns, write latency tracks index size, and analytical tables lose buffer cache efficiency. No single slow dashboard proves that Postgres is unsuitable.
Four concrete techniques that extend analytical capacity without leaving Postgres
Time partitioning narrows the work before execution begins. Declarative range partitioning lets the planner skip partitions outside a query’s time bounds, which suits time-shaped analytical tables. Time partitioning also makes retention cheaper because DETACH PARTITION followed by DROP TABLE removes an expired partition through metadata operations, while a time-bounded DELETE creates WAL records for each row and leaves bloat until vacuum runs. Partitions should remain in the hundreds rather than thousands, because excessive partition counts can make planning more expensive than execution.
BRIN indexes address the storage cost of indexing large, naturally ordered tables. A timestamp B-tree over hundreds of millions of rows can occupy many gigabytes, while a BRIN index stores minimum and maximum values for page ranges and is measured in megabytes. Physical ordering is the condition that makes this useful. For append-only event data, teams should check pg_stats.correlation before creating the index and re-CLUSTER on the timestamp when out-of-order arrivals undermine that correlation.
Pre-aggregation removes repeated computation. If a dashboard asks the same five questions, a materialized view can calculate the answers ahead of time. REFRESH MATERIALIZED VIEW CONCURRENTLY, supported by a unique index, allows readers to keep consuming a consistent result during refresh. For incremental rollups, a watermark and a merge of new data limit the work to arrivals. Pre-aggregation is the highest-leverage intervention because it eliminates consumers’ repeated scans of history.
Settings for the reporting role then give the scans that remain the resources they need. Raising work_mem, max_parallel_workers_per_gather, and effective_io_concurrency for a dedicated reporting role keeps those analytical settings from being applied to all transactional traffic. Memory needs particular care because joins and parallel workers multiply allocations. Modern Postgres can parallelize query execution across cores, while statement_timeout prevents runaway analytical queries from occupying a reporting replica indefinitely. Together, these techniques buy time and capacity within a limited scale.
When a Postgres extension changes the equation through pg_duckdb and the columnar tier
Extensions can help when changing the query shape is not enough. The extensions offer vectorized execution, columnar storage, distributed planning, and ways to read remote analytical files without moving to a warehouse right away. These capabilities serve distinct purposes. In particular, pg_duckdb runs DuckDB’s vectorized execution engine over PostgreSQL’s existing row-oriented storage, so its gains do not include columnar compression for those tables.
The pg_duckdb 1.0 announcement describes the strongest acceleration where queries cannot use indexes efficiently, with more modest gains when full indexes are available. The extension also queries remote Parquet files on S3, GCP, or Azure from Postgres SQL. That provides a lakehouse query path within the existing database interface. But each PostgreSQL connection gets its own DuckDB instance, so teams need to set resource limits with care and install the extension on both primary and replicas.
Other extensions address different requirements within the same architecture. citus suits horizontal scaling with familiar SQL through distributed PostgreSQL, columnar storage, and a distributed query planner. Hydra columnar provides AGPL 3.0-licensed on-disk columnar storage, while pg_mooncake provides columnstore tables under a permissive open-source license. pg_parquet copies data between Postgres and Parquet, making it relevant to prepared analytical datasets. The choice depends on whether the constraint is execution, storage layout, distribution, or interchange, rather than a general desire to make Postgres a warehouse.
Where the limit actually is and the signals that you have reached it
PostgreSQL’s core tuple-at-a-time execution engine remains a structural limitation, and scanning billions of rows with sub-second latency is not a reasonable promise for this architecture regardless of hardware. Vectorized execution and columnar paths help particular workloads. They do not make every query, dataset, and concurrency pattern suitable for the same deployment.
Predictability is the more useful boundary for operational analytics. Active subscriptions, completed actions, support workload, retention cohorts, revenue rollups, and user activity summaries can remain in Postgres when their questions are bounded. High-cardinality product events with billions of rows, marketing attribution that draws on multiple external sources, and sub-second BI over multi-year fact tables go beyond that boundary. Most early Supabase teams are solving the first class of problems.
The practical working range is roughly 100 GB–1 TB, conditional on tuning and extensions applied. The diagnostic signals described earlier remain decisive. A bounded rollup and an unrestricted historical scan can demand very different architectures at the same data volume.
Pre-modeled datasets as the analytical layer and what this means in practice
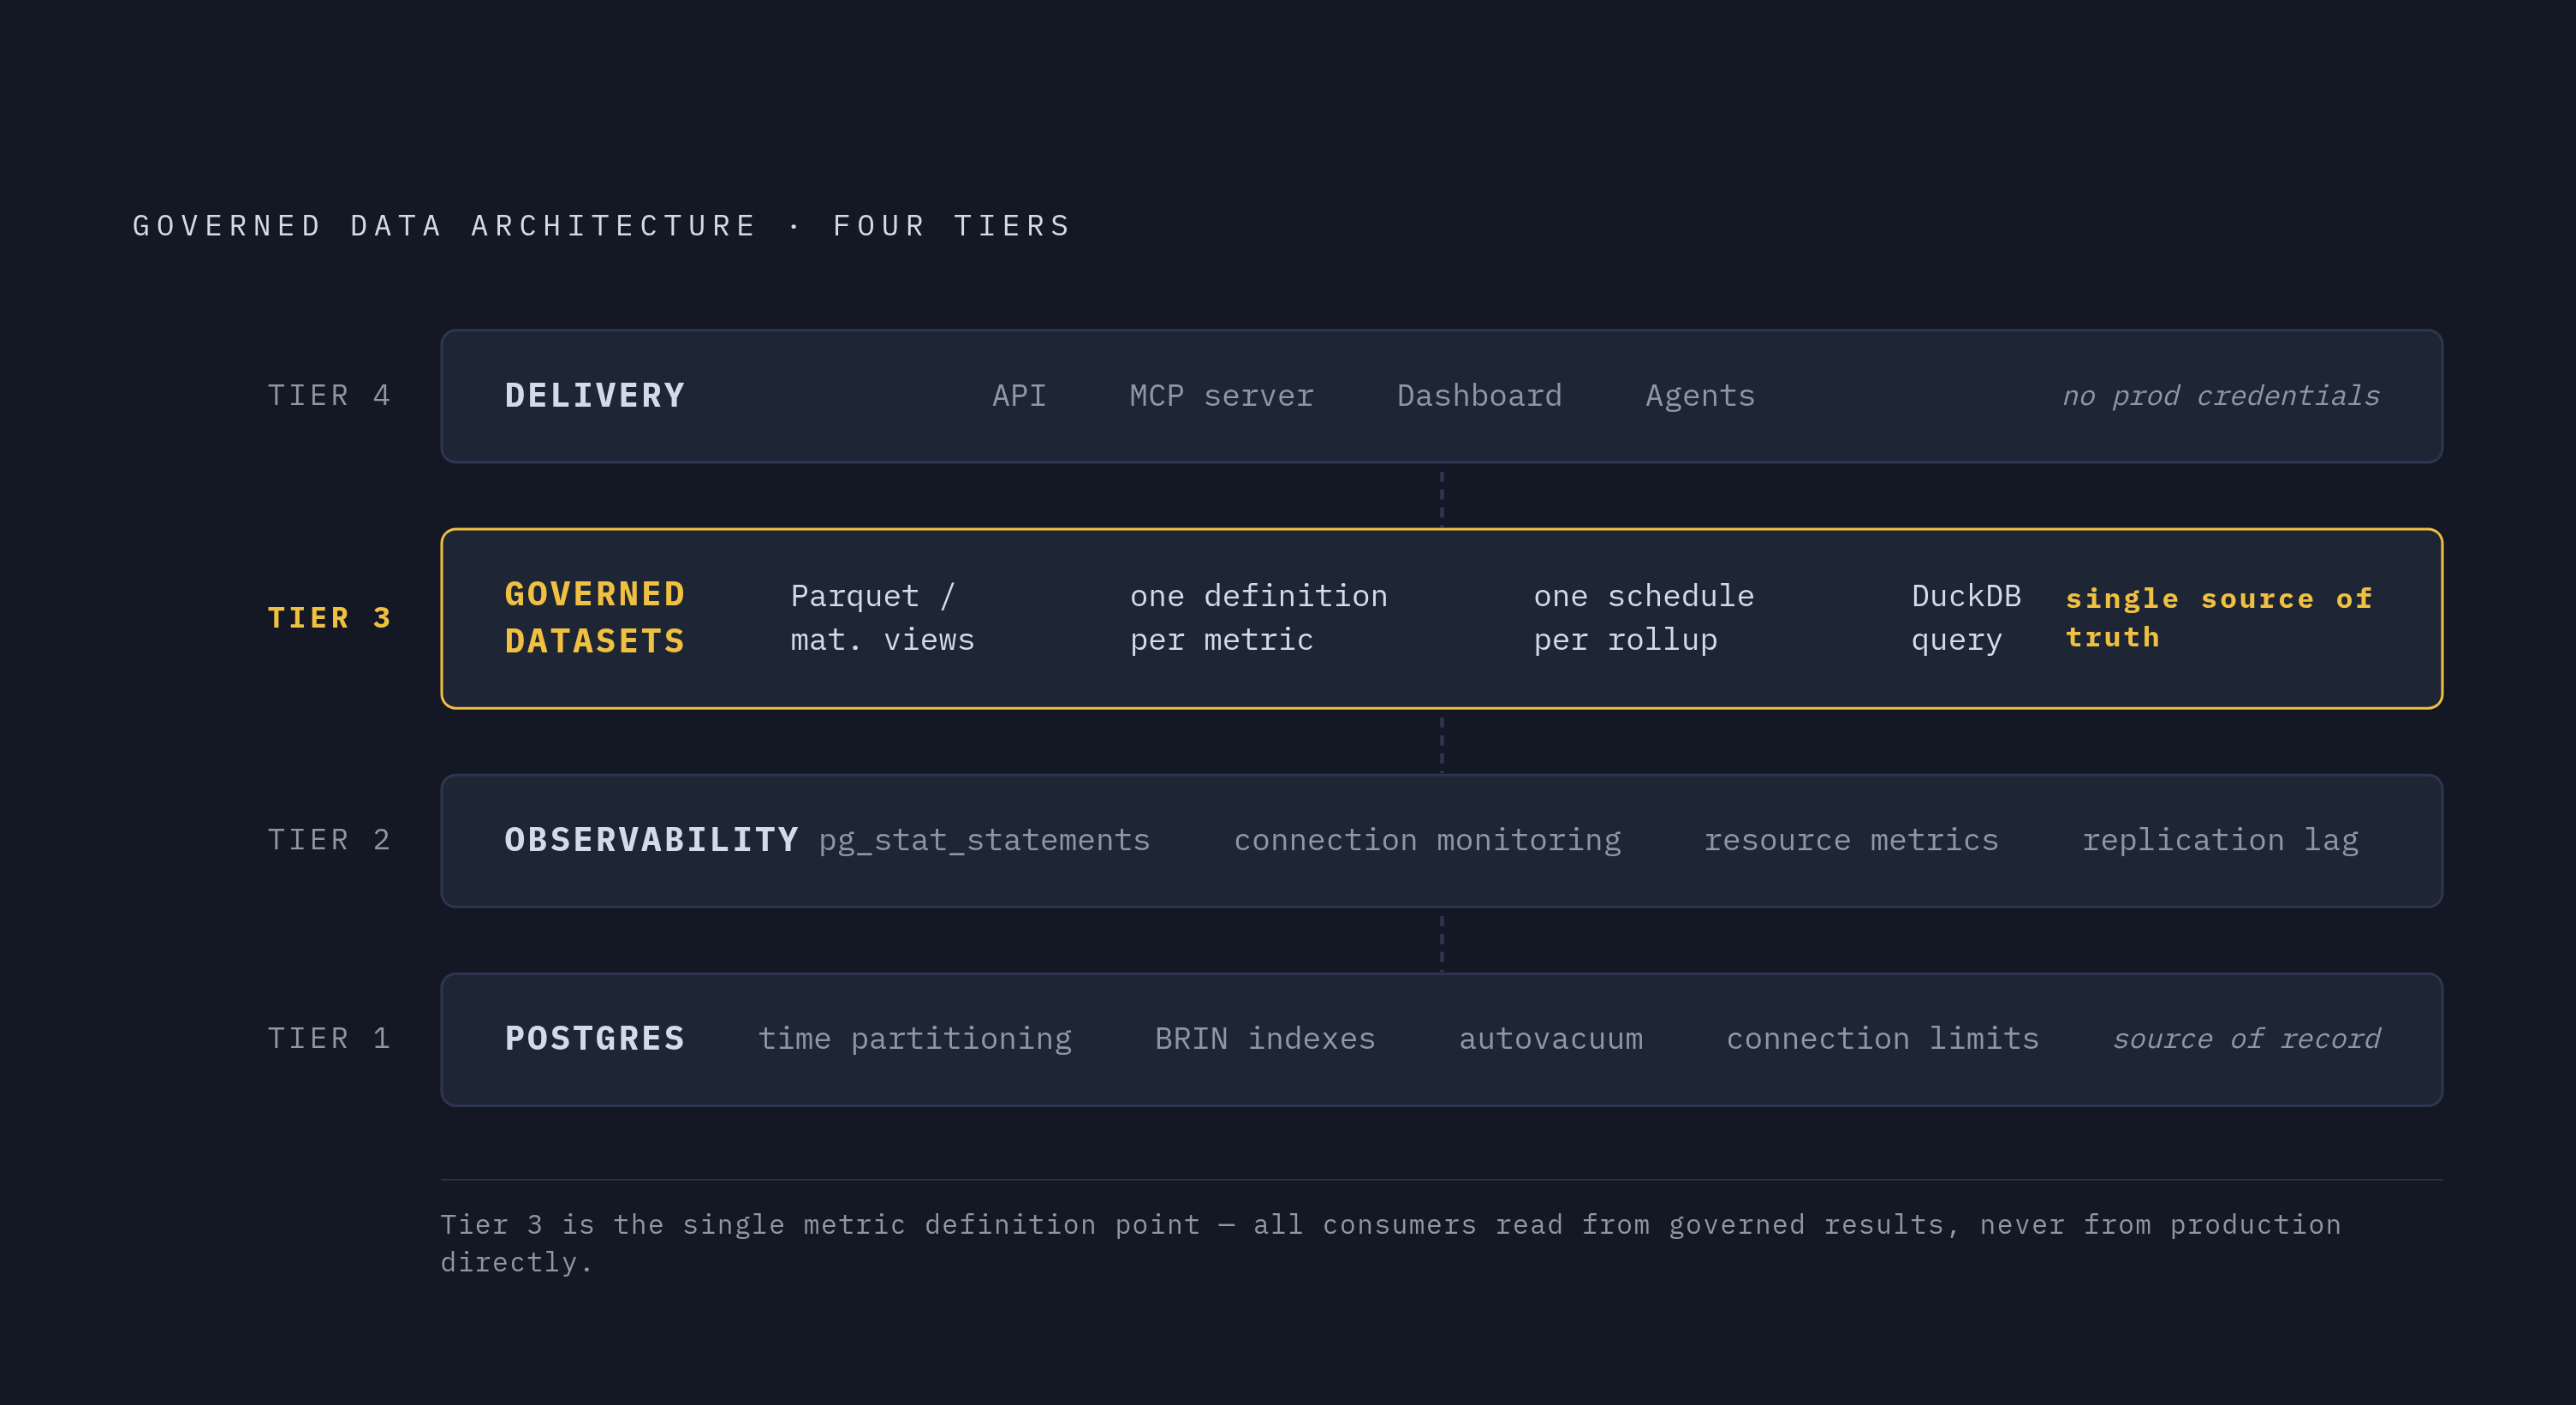
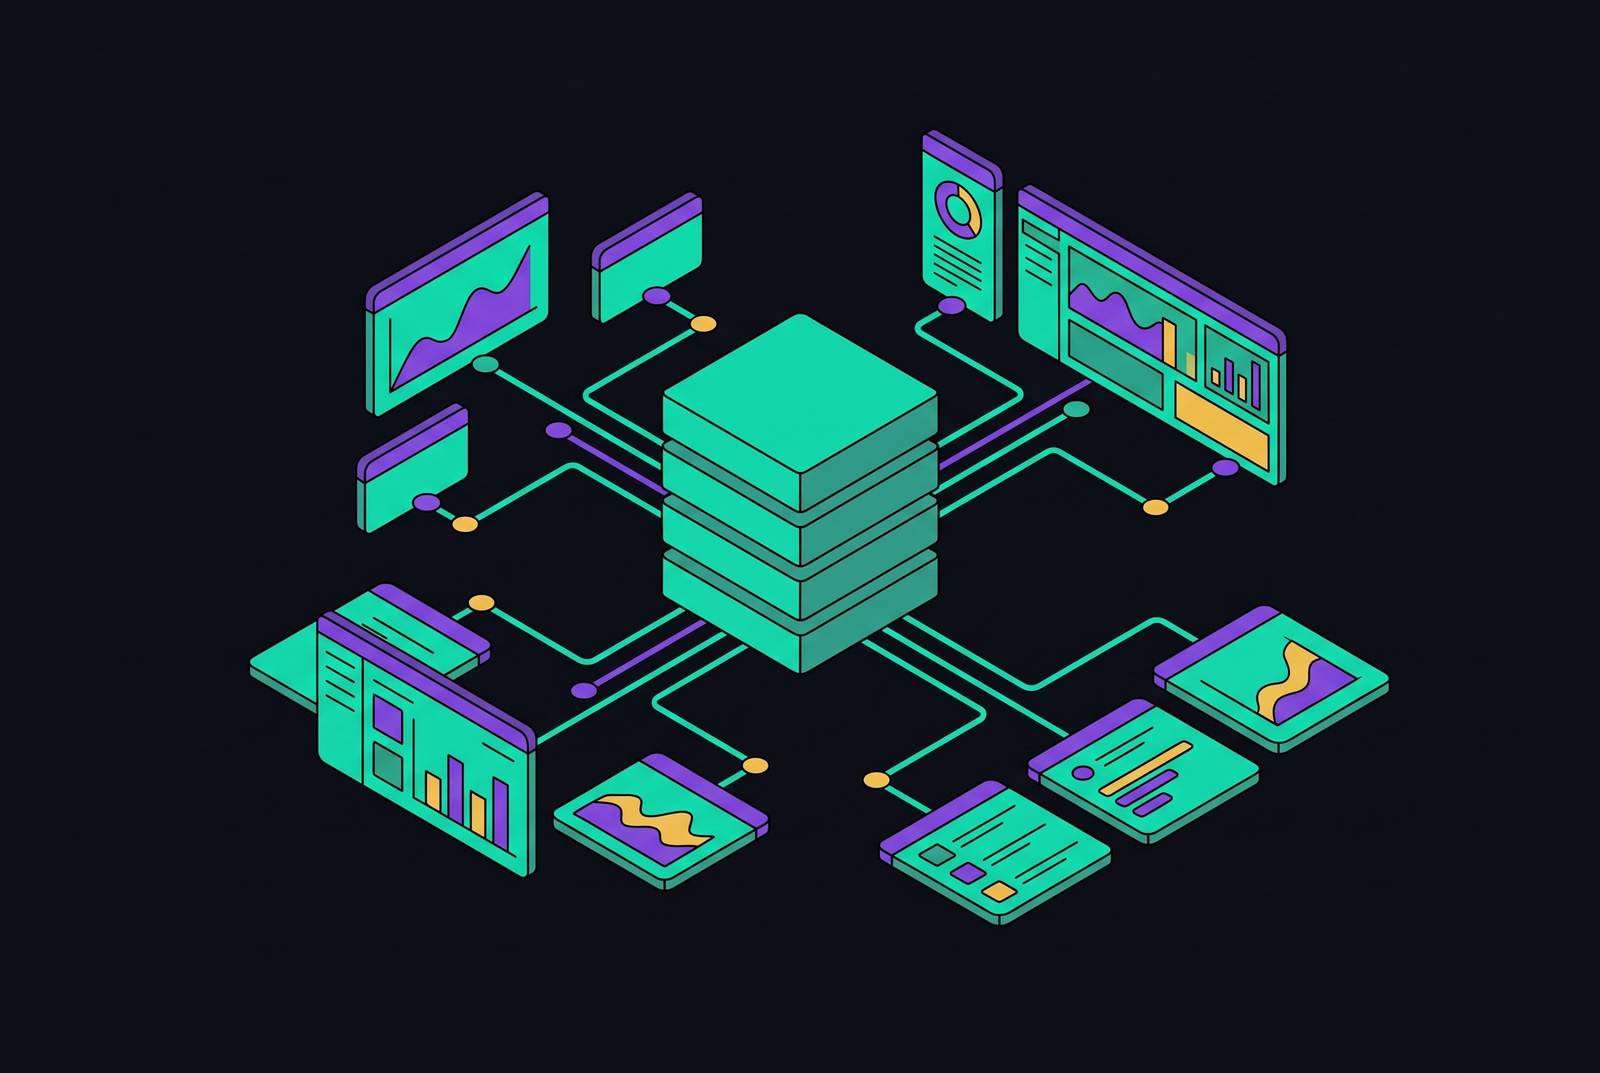
The stronger architecture changes what consumers are allowed to query. Instead of making every dashboard calculate metrics against live tables, it prepares governed datasets on a schedule, on data arrival, or through a defined refresh cadence. Results live in Parquet or a materialized queryable layer. Consumers then read calculated answers without accessing production tables at query time.
This creates a single metric definition layer for Supabase SaaS teams. One definition of an active subscriber or completed conversion is calculated once and consumed by applications, reports, and agents. The modeling layer owns the meaning of the number. Individual consumers no longer reconstruct that meaning through slightly different filters, joins, or aggregation rules.
Prepared datasets also separate analytical shape from transactional shape. Postgres tables can remain normalized for transactional integrity, while consumer-facing datasets are wide, denormalized, or aggregated. DuckDB can query the Parquet results directly, either independently or through pg_duckdb, without a warehouse hosting them. This concentrates the work of defining metrics and refreshing results in a governed layer.
Why AI agents make the pre-modeled data layer urgent, not optional
Broad production access combines machine-speed execution with unpredictable SQL and potentially consequential permissions. The OWASP LLM Top 10 identifies Excessive Agency as a risk associated with overly broad access, including irreversible changes to critical databases. Even queries that read data can cause full-table scans or lock contention, or return results affected by in-flight transactions.
A read replica protects production capacity but is insufficient on its own. An agent that can issue arbitrary SQL still needs restrictions on what it can access and calculate. To keep access safe, requests go through a gateway that enforces permissions and logs access, with service accounts set up for specific tasks and given only the permissions they need. GDPR Article 5(1)(c) establishes the related data minimization requirement that personal data be adequate, relevant, and limited to what is necessary.
MCP provides a connector. Its server can give an agent structured access to a data source, but it does not itself clean, transform, or govern that source. Customer-facing analytics therefore requires each MCP connection to be scoped to one customer’s data. With permissions enforced, a single MCP server can expose governed Parquet datasets queried through DuckDB, giving an agent usage analytics without a prebuilt dashboard UI.
Observability on Supabase as a prerequisite for analytics that can be trusted
Pre-calculated metrics are only trustworthy when their inputs and refreshes are understood. Slow queries can delay aggregation, connection spikes can interfere with processing, and replication lag can make results stale before consumers read them.
Query-level monitoring starts with pg_stat_statements, which is fully enabled by default on Supabase. It records mean execution time, total time, and call count, exposing which queries create analytical load. Connection monitoring adds visibility into open connections, their activity, and waiting work. CPU, memory, I/O, disk, and replication lag then show whether slow refreshes reflect resource pressure or delayed inputs.
Supabase Studio’s aggregate metrics do not provide enough detail to diagnose every refresh or connection problem. The Supabase Metrics API exposes Postgres performance metrics to compatible monitoring systems, while logs and traces can flow into compatible observability systems for deeper visibility. Alerts when CPU or memory use stays high give teams time to act before users notice a slowdown. When teams move from routine service-health checks to asking why particular user journeys have unexplained delays, they need tracing and high-cardinality metrics. For analytics, their purpose is to explain whether a metric is current and why its preparation may have failed or slowed.
What analytics backend fits a Supabase team that wants full API control without a warehouse
A backend built around Postgres with governed datasets fits teams that have a bounded set of operational questions and want to keep control of the interface that delivers the results. Its foundation is Postgres as the source of record, with time partitioning, appropriate BRIN indexes, tuned autovacuum, and enforced connection limits. The next layer adds observability with query statistics, connection monitoring, resource metrics, and a view of replication lag.
Governed Parquet datasets or refreshed materialized views provide one definition per metric and one schedule per rollup, with DuckDB available to query the prepared data. The delivery layer exposes those results through an API, MCP server, or dashboard. No opinionated frontend is required, and agents access governed results without production credentials.
The recommendation depends on the workload. A team that provides subscription counts, retention cohorts, revenue rollups, and daily active user counts can use this stack without adding a separate warehouse. A team beyond the stated working range, or demanding sub-second analysis across multi-year fact tables, needs to revisit the architecture. Setting clear definitions, refresh boundaries, and access controls early gives teams a basis for that later decision before a crisis forces their hand.