Push vs Pull Analytics Delivery for Operator Teams
Pushing governed metrics to operators beats waiting for dashboard checks.
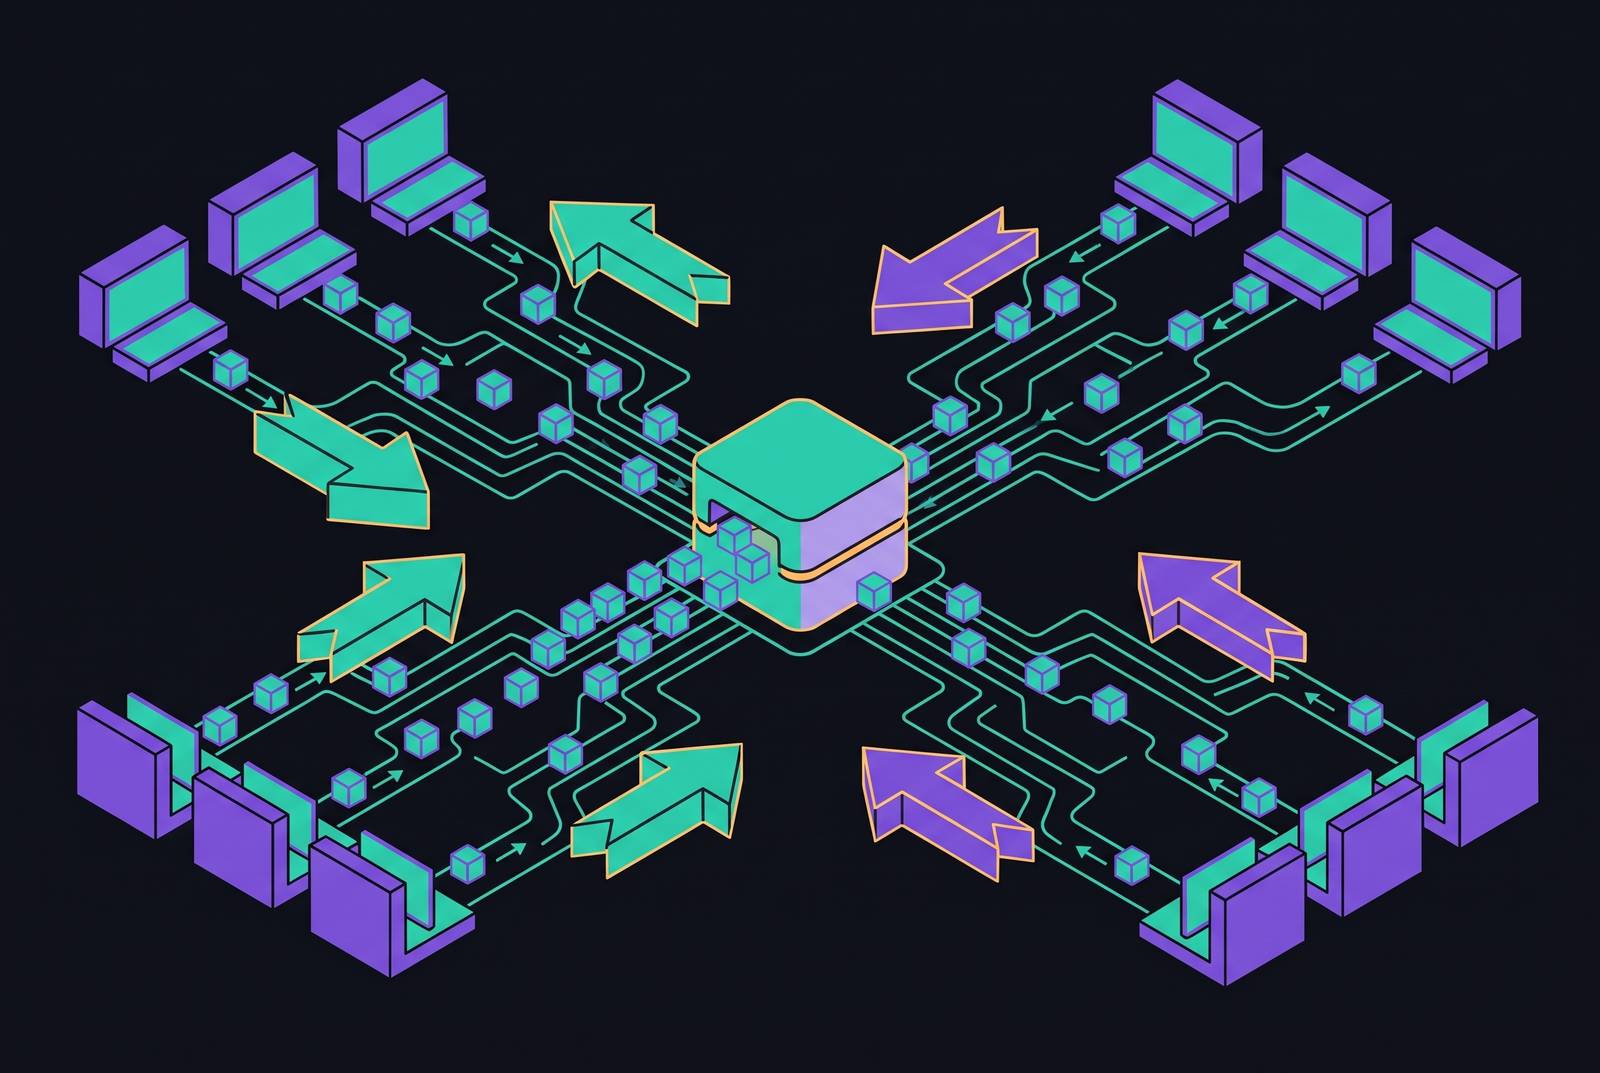
For Supabase SaaS teams, a single metric definition layer should serve both pushed updates and on-demand analytics through APIs or MCP, without tying either to a particular dashboard UI. Push vs Pull Analytics Delivery for Operator Teams makes the case for pushing pre-calculated metrics that drive daily decisions and retaining pull for investigation. The governing principle is one shared definition, regardless of who receives the number or how.
Why operator teams are structurally disadvantaged by pull analytics
A dashboard can be available all day without influencing the decision that matters. With pull analytics, an operator has to remember that the information is there, stop another task, and ask for it. Until that happens, the dashboard waits silently. Its availability solves the problem of access, but not the problem of attention.
Founders, small teams, and heads of growth often have several roles at once. Each role has its own questions, and each context switch makes it harder to remember which dashboard needs attention. On a busy day, checking a metric competes with the work that the metric is supposed to inform. The resulting delay is not merely inconvenient. A decision may be made on stale or absent information, or the opportunity to make it may pass altogether.
The strongest defense of pull is that a disciplined team can always check. That is true as a description of a process, but it does not change the architecture. A process that depends on spare attention is most vulnerable when operational load is highest. The system was never designed to interrupt, so silence cannot distinguish an uneventful day from an important change nobody noticed. The structural remedy is to change how information reaches the operator, rather than make remembering another operational responsibility.
What push delivery actually means in an analytics context
Push analytics sends pre-calculated metrics to the places where operators already work, on a schedule or an event trigger. The recipient does not have to initiate the delivery. A threshold crossing, a schedule firing, or a detected pattern causes a report to be made and sent. Pull waits for a request, while push starts delivery without one.
Where metrics arrive matters because each channel gets an operator’s attention in a different way. Email suits detailed reports that can be read at the recipient’s own pace. Slack or Teams puts metrics into conversations where people are already making decisions. Mobile delivery surfaces urgent events before someone opens a reporting tool, and these channels are useful because they meet existing work habits.
The content also distinguishes push analytics from generic notifications. An alert may say that something is wrong, but a pushed analytical update delivers the metric, its context, and often its trend. It should give operators enough information to act on, beyond telling them that something may be wrong. That requires a pre-modeled number with a settled meaning. From the operator’s side, the useful experience is receiving an interpretable answer when it matters, rather than receiving another instruction to go looking for one.
The architectural tradeoff operators need to understand before choosing a delivery model
Push has a clear failure shape, which is that the producer controls volume. Push systems can fire 50,000 webhooks per second during producer spikes. A consumer cannot choose to take them in more slowly. When incoming events outrun consumption, the overflow becomes failed deliveries, retries, or noise. Low latency therefore comes with exposure to upstream bursts.
Pull reverses that control by letting the consumer determine the rate. It provides natural backpressure and can survive consumer outages because retrieval resumes when the consumer is ready. The cost is latency when refresh schedules are weak or nobody initiates a request. Scheduled polling can reduce dependence on memory, but it still makes freshness depend on the retrieval schedule.
For attention-constrained operators, invisible delay is often more dangerous than visible noise. Notification overload is an evident problem, whereas a dashboard can remain silently out of date for the decision at hand without drawing attention to the gap. That makes push’s failure more manageable in this context. The choice turns on which failure the event can afford. High-consequence changes favor prompt delivery, while open-ended investigation benefits from control over retrieval.
Headless analytics infrastructure makes that distinction possible without choosing a single front end. By separating metric calculation from delivery and exposing the data through APIs or MCP, it can serve dashboards and pushed updates from the same governed layer. Delivery then becomes a choice about use, with the same trusted numbers across channels.
Why pre-calculated metrics are the unit that makes push delivery work
Sending a number whose meaning is unclear does not make it safe to trust. If each destination calculates its own answer when a message is sent, the numbers agree only if those calculations agree. Push analytics therefore needs a defined unit of delivery, which is the pre-calculated metric. The number is modeled once, written once, and then distributed. The number is calculated upstream once for all recipients, channels, and agents.
This separates a governed metric from an individual query result. A query result answers the query that ran against the data available at that moment. It does not, by itself, establish that another recipient used the same definition. A governed metric derives its authority from a definition shared before anyone requests or receives it.
Pre-calculation alone is not a guarantee of correctness. The calculation must embody the intended definition, and every delivery must draw from that same source of truth. Otherwise, a team has automated distribution without resolving disagreement. Interpretation and calculation were settled before the number entered separate workflows.
For an operator receiving a metric at 8am, this distinction has a direct consequence. If the number must be independently reconstructed before it can guide a decision, delivery has saved a dashboard visit but preserved the verification burden. Governed pre-calculation removes the need to establish consistency anew for each message. An AI agent needs the same assurance when it consumes metrics through an API or MCP server. That requirement becomes more consequential when the recipient can act automatically.
How agents change the stakes of push vs. pull for operator teams
Agents make inconsistent analytics more dangerous because an uncertain number can immediately become an automated decision. An agent querying a production database directly inherits the latency and consistency problems of on-demand analytics. Moving retrieval to a warehouse does not automatically solve freshness, since batch refreshes are often hourly or longer. Decisions that affect real money or inventory may need to happen sooner than that. The architecture must therefore address both the meaning of the metric and when it becomes available.
Putting production credentials in agent configuration opens up a security surface that static role assignments cannot keep safe on their own. Agents need to be able to read analytics without being able to write to production. The safer pattern separates agents from live queries against the primary by routing them to pre-modeled, governed datasets. Their analytical context then comes from the same definitions used for human operators.
MCP, or Model Context Protocol, is an open standard for connecting AI agents to external systems. A stateless MCP server can expose governed, pre-calculated metrics as tools without exposing the production database. The governed layer must still sit between the agent’s tools and the sources the data comes from. Otherwise, easier access merely makes ungoverned retrieval easier to automate.
Dreambase implements this pattern with governed Parquet datasets queryable via DuckDB and exposed through a single MCP server. Agents query the modeled datasets, keeping their queries off the production Supabase database. This is a concrete option for teams that want analytical context through an API or MCP instead of making a prebuilt dashboard the point of access. The important criterion is the boundary it establishes between production data and governed consumption. Push and pull can both work across that boundary while keeping the same metric definition for every agent.
How do Supabase-backed teams put push analytics into practice?
For a Supabase-backed team, the first requirement is to move analytical work away from the production primary. That separation does not necessarily require a separate data warehouse or a dedicated data team. Supabase read replicas handle high-read workloads, including dashboards and reporting paths that do not require immediate write consistency. They provide an initial boundary between transactional and analytical load. They do not, by themselves, define the metrics or decide how those metrics should reach operators.
For heavier analytical throughput, Supabase announced new Pipelines destinations at Select 2026 to stream Postgres data to downstream OLAP engines in near real time. That moves analytical queries to systems separate from the production database. It does not remove the write-scaling constraint of a conventional Supabase project, where writes converge on a primary Postgres database. Very large write-heavy systems may still need more changes to how they are built. Supabase’s Multigres was in private alpha as of October 2026, so that constraint should not be treated as already resolved.
Teams need to see connection count, query latency, and error rate before they can count on pushed metrics. Supabase’s Metrics API exposes roughly 200 Postgres metrics in a monitoring-compatible format, including CPU, IO, WAL, connections, and query statistics. These measurements describe the health of the database supporting the analytical path. They serve a different purpose from business metrics, but both matter when a team expects delivered numbers to be dependable.
Teams can use read replicas to handle reporting load, downstream OLAP engines for heavier analytics, and a governed delivery layer such as Dreambase. For small teams, Dreambase extends a Supabase project with pre-modeled datasets, MCP access, and delivery through email, Slack, or mobile, without requiring ETL, schema changes, or new infrastructure. The number is calculated before distribution rather than generated as a raw query result for each message.
When to push, when to pull, and how to decide for your team
The decision starts with the consequence of delay. If a metric would change a decision made today, it should be pushed. Revenue anomalies, churn signals, billing events, error rate spikes, and threshold breaches fit when a one-day lag means a missed intervention. Their value depends on reaching the recipient before the opportunity to respond closes.
Pull belongs where a specific question determines what should be retrieved. Deep retrieval, user-specific context, historical investigation, and source verification all benefit from a consumer who controls the inquiry. A metric can wait to be pulled when the question it answers arises for the operator. At the system level, webhooks or direct API calls favor push when real-time delivery is required. Control over schedules, backfills, and data windows favors pull.
Pre-calculated, governed metrics should supply the decisions an agent makes autonomously through its MCP-connected workflow. Agents should also be able to use pull to fetch deeper context on demand, with the right governance and read-replica routing. An agent’s need to investigate does not justify unrestricted access to production. A pushed update still needs to be checked against the context behind it.
The hybrid to avoid is one that changes definitions when it changes channels. A Slack update, a dashboard, and an agent response cannot form a trustworthy operating system if each draws a different answer from a different source. For Supabase SaaS teams seeking full API control without an opinionated frontend, the decisive requirement is a single metric definition layer.