AI-Generated Reports vs Static Dashboards for Small Teams
Pick the format by task, but fix your metric definitions first.
AI-generated reports versus static dashboards is an infrastructure decision for small teams. AI reports suit routine, scenario-specific questions, while dashboards suit stable, shared metrics, but neither fixes inconsistent data. For Supabase SaaS teams seeking full API control without an opinionated frontend, the useful architecture is a headless analytics backend with a single metric definition layer that serves reports, dashboards, and agents from governed, pre-calculated datasets.
Why small teams face a different analytics tradeoff than enterprises do
Traditional business intelligence assumes a specialist will define metrics, write queries, build charts, publish dashboards, and maintain them. Large enterprises can afford to split the work this way. Lean startups often cannot, though founders, product managers, and operations leads still need answers in time to act. The constraint is not simply the cost of analytics software, but the absence of someone responsible for turning operational data into dependable decisions.
A conventional dashboard requires more than an initial build. A new filter, changed calculation, or added breakdown creates another development cycle before the team can answer its follow-up question. Some useful reports therefore never get built because their value does not justify weeks of work and ongoing maintenance. For teams operating lean while managing growing complexity, the choice of format is ultimately a question of which infrastructure they can sustain.
What separates an AI-generated report from a static dashboard in practice
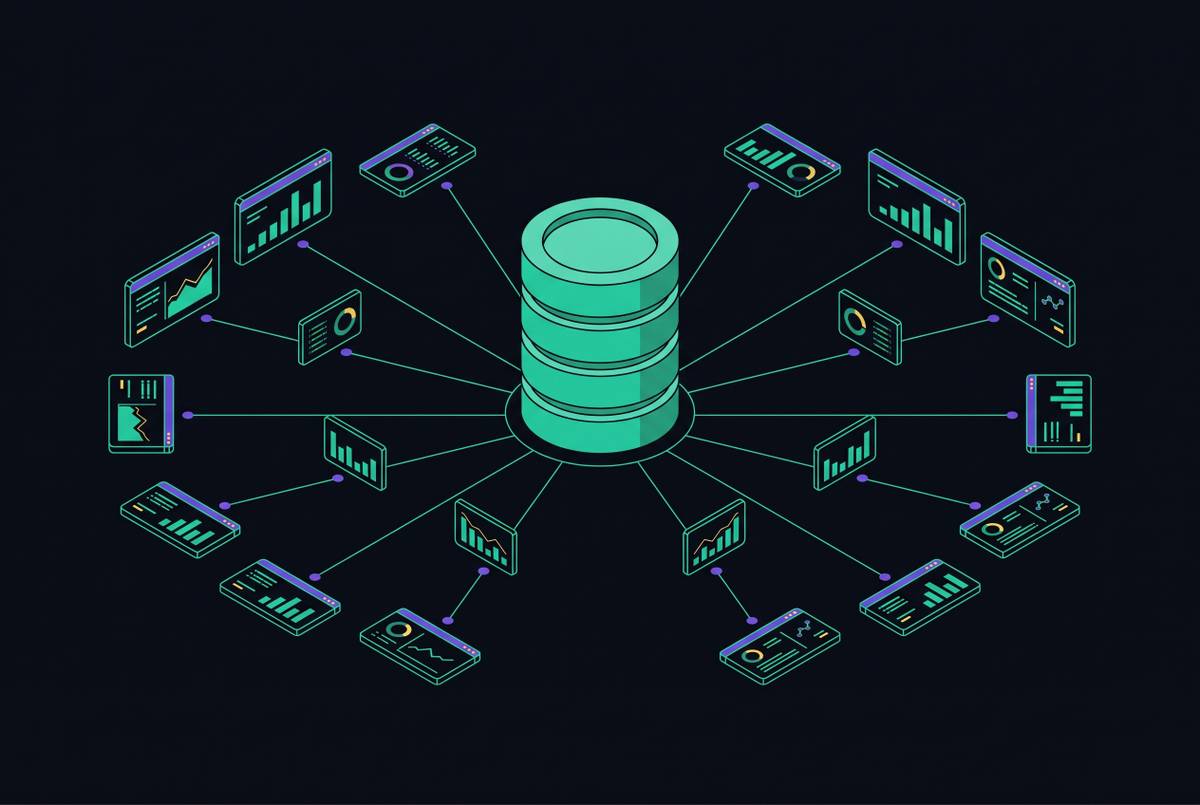
A static dashboard is a persistent, manually designed visualization layer built over a data warehouse or semantic model. It is built for governed data marts, standardized metrics, scheduled refreshes, and the same people using it again and again. “Static” describes the reporting structure. Users return to an established layout rather than asking the system to assemble a new report for each question.
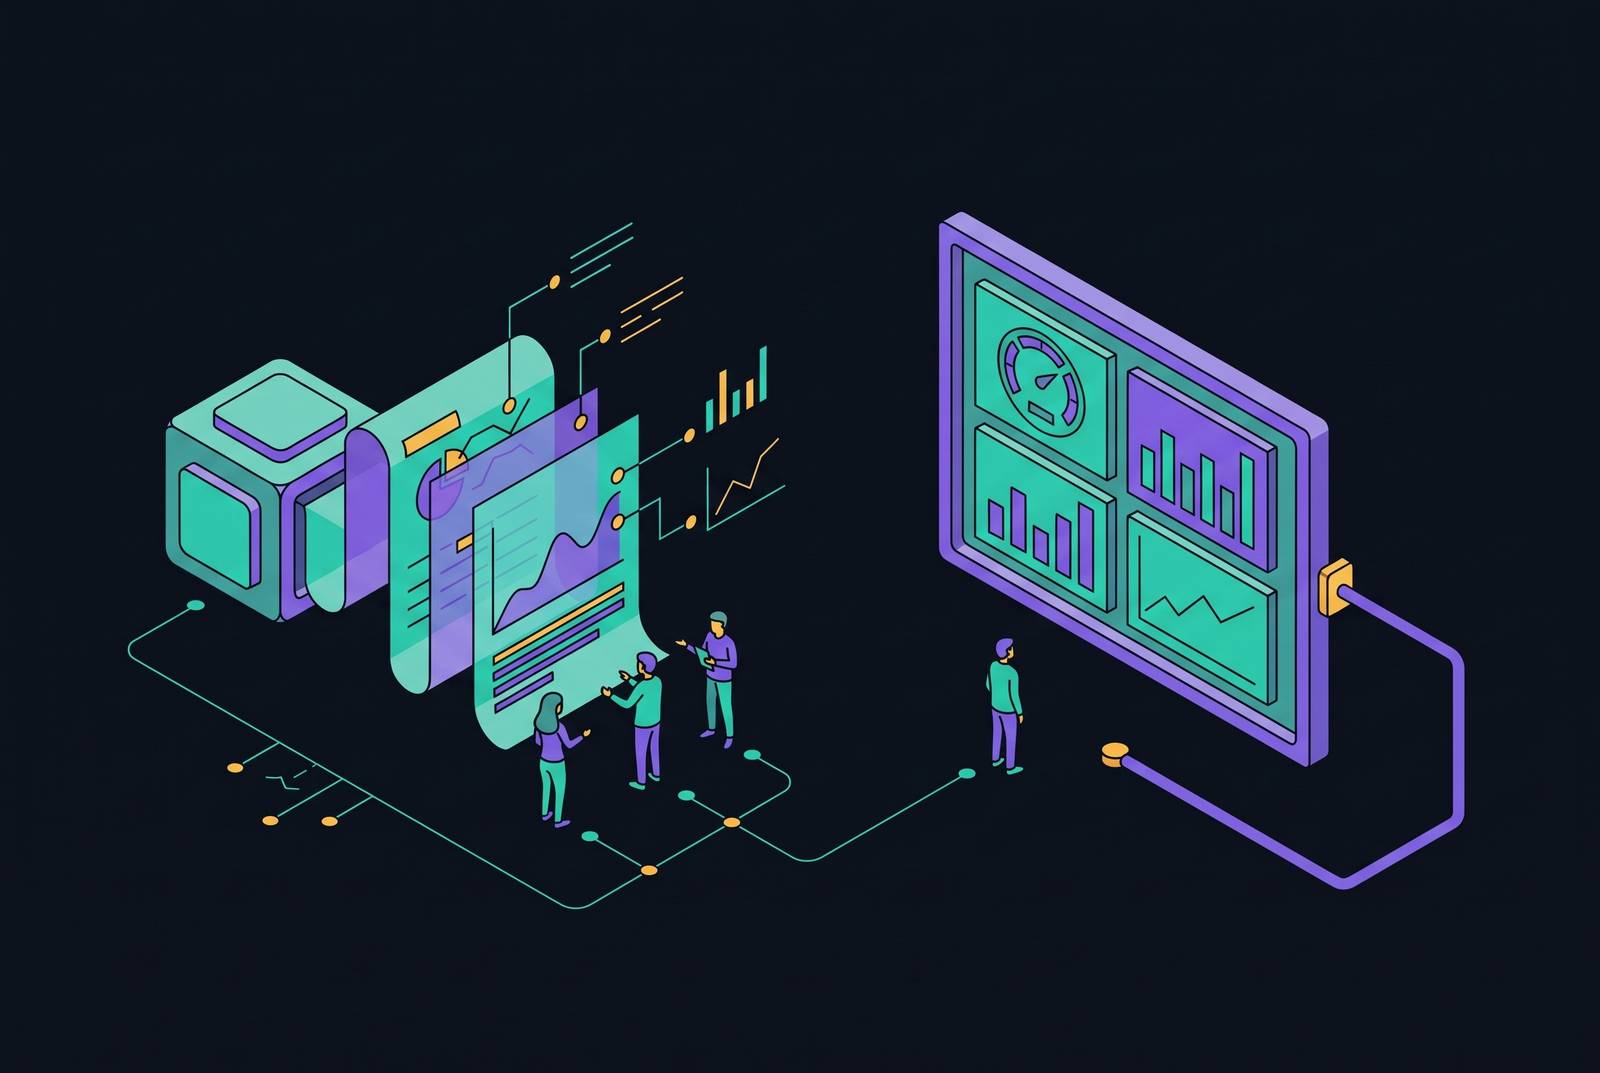
An AI-generated report assembles an output from structured operational data in response to a request. Logsheet.ai describes how to connect an LLM directly to a PostgreSQL operational database and let a user ask for the report they want in natural language. The system generates a reusable template that can be regenerated on demand with current data. The output may be HTML or text. Here, the model organizes tables, KPIs, calculations, and charts rather than requiring a person to navigate a predetermined layout.
A moderately complex conventional dashboard typically costs several thousand dollars and takes weeks to build, while an AI-generated report on the same data may cost a few dollars a month at a regular cadence. These solutions operate at different levels: a dashboard establishes shared reporting infrastructure, while an AI report can serve one manager’s changing operational question. The comparison therefore turns on which level fits the reporting task.
Where each format wins and where it fails for small teams
Query volume, recurrence, and the cost of a wrong answer determine the fit. AI-generated reports work well for routine work done in large amounts, such as daily ad spend rollups, weekly sales pipeline reports, and automated anomaly monitoring. These tasks recur often enough to benefit from automation without necessarily justifying a persistent dashboard. With natural language access, founders, marketers, and operations leads can also ask questions without knowing the schema or waiting in a SQL queue.
Static dashboards work well for board-level KPIs, shared revenue tracking, and figures that dozens of people check each day. Visual familiarity and stable framing take precedence over flexibility in those settings. For routine work done less often, including monthly expense reports and quarterly board decks, doing it by hand may be better because AI setup takes more time than it saves. A board deck assembled occasionally is not the same reporting task as a board-level KPI monitored continuously.
Speed strengthens the case for automation but does not settle it. Improvado’s analysis found that AI-powered approaches reduce reporting time by 80% by automating data preparation, transformation, and visualization. An analyst-built dashboard can appear safer than a generated report, and that objection is justified when the model calculates the numbers itself. The reliable alternative keeps the model out of the arithmetic and makes the data layer responsible for the figures.
Why AI report accuracy depends entirely on the data layer underneath it
Logsheet.ai’s account draws a clear boundary between assembling a report and calculating its results. The model should organize report logic and pass queries for totals, averages, or deviations to the database. The database or pre-calculated dataset performs the arithmetic. This division gives the model a structural role, including selecting what to surface and explaining the result, while grounding the numbers in computed data.
Correct arithmetic alone is not enough, however, because a database can faithfully calculate an inconsistently defined metric. A product database, Stripe, a CRM, and spreadsheets may each represent a different part of the business without sharing one definition of its performance. Improvado’s research found that fragmented systems cause 65.7% of analytics failures. AI can amplify that fragmentation by turning inconsistent inputs into apparently coherent recommendations.
Small teams face a higher trust burden because they lack an analyst who can catch those discrepancies before someone acts. Governed pipelines, integrated systems, and consistent metric definitions are therefore prerequisites. Manual verification exposes the gap in that foundation. If every generated number still needs checking, the team has not established the governed connection required to rely on the output.
What does a single metric definition layer look like for a Supabase SaaS team?
Supabase is built on Postgres, which suits SaaS products, marketplaces, and analytics-heavy applications that depend on relational integrity and transactional consistency. Analytical workloads create performance and correctness risks when they run against operational data. User-facing writes should not have to compete with expensive reporting queries. For a Supabase-native team, the governed analytics layer sits beside production rather than treating raw production tables as the reporting interface.
The operational guidance is to monitor slow queries, avoid unbounded table scans, and paginate large result sets. Expensive reporting workloads belong on replicas, materialized views, or dedicated analytics layers. Without pre-modeled metrics, each dashboard, AI report, and agent can get a different answer from the same raw tables. “Revenue” in a marketing report may then diverge from “revenue” in the finance view even when both queries execute correctly.
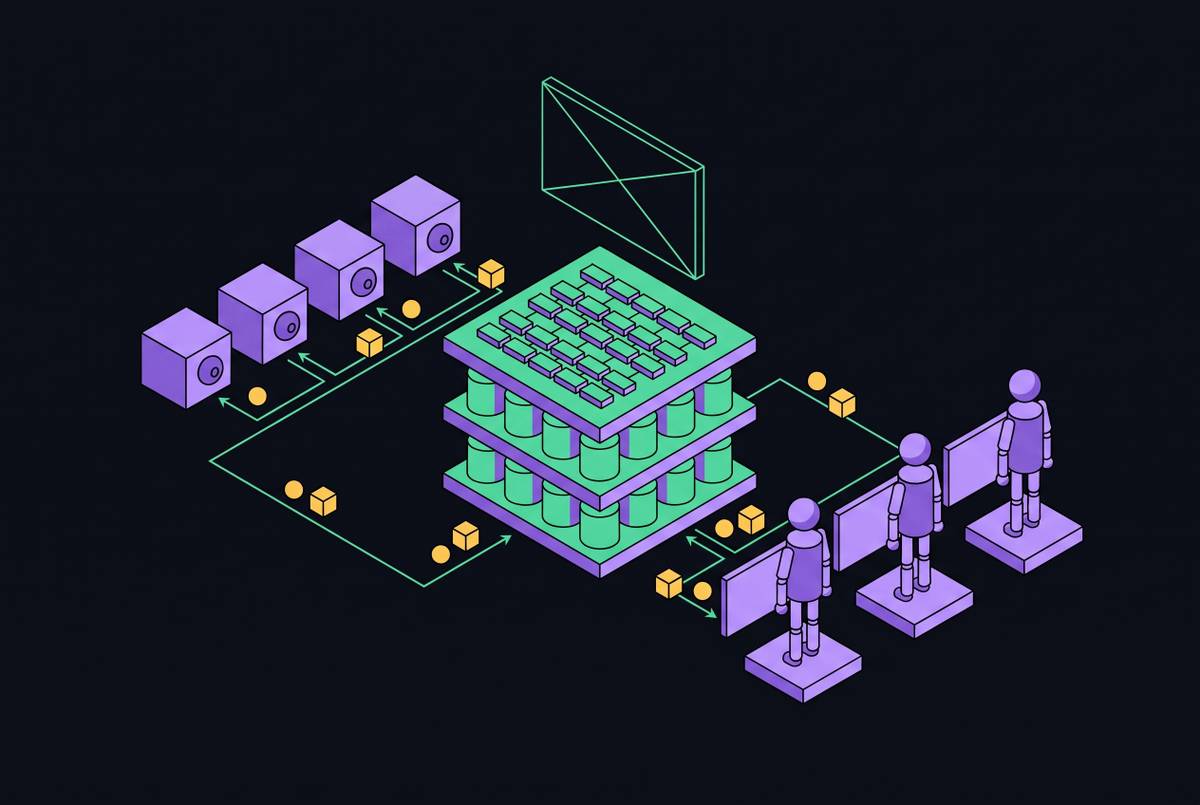
The useful unit of analytics is therefore a modeled, pre-calculated dataset. Metrics are calculated once, governed centrally, and made available wherever they are needed. Both humans and agents consume the same definitions. This is what a single metric definition layer means for a Supabase SaaS team in practice. The founder’s report and an agent’s recommendation draw on the same pre-calculated metrics instead of independently reconstructing the business logic.
Why AI agents querying production databases create a different category of risk
A human-readable report leaves an opportunity for review before action. An autonomous agent changes that boundary by consuming data to make decisions that can affect money, inventory, or customer experience. Direct production access therefore introduces security exposure and workload risk as well as analytical inaccuracy. Small teams are poorly positioned to catch these failures. They may have no security team, database administrator, or audit log review process between an unsafe query and its consequences.
The recommended pattern routes agent database queries through a centralized gateway that enforces permissions and logs access. Analytical queries go to read replicas, and agents are limited to approved query patterns rather than receiving production credentials in their configuration. Permissions must also govern the returned data. Attribute-based access control can restrict records through row-level security and redact sensitive fields through column-level masking. A fraud detection agent can therefore get transaction amounts without getting payment card numbers, even when it is allowed to run the query.
Warehouses that refresh on batch schedules may provide data that is hours old, which is unsuitable for agents making time-sensitive operational decisions. The sandbox principle adds another boundary: agents get governed data, work in an isolated environment, and promote changes only after they are approved. An MCP server can provide standardized access to this architecture, but the protocol does not replace its permissions, freshness requirements, or isolation.
How MCP-native data infrastructure makes AI reports and agent queries use the same governed definitions
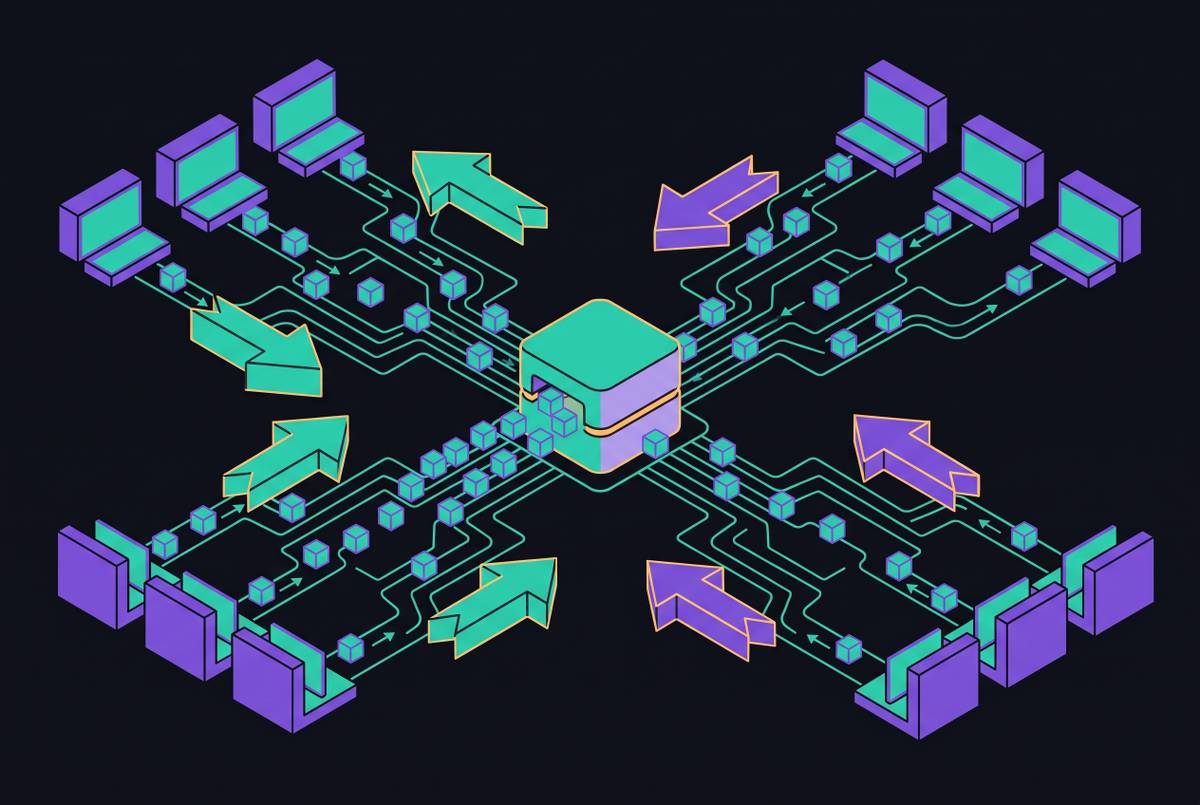
The Model Context Protocol provides a standardized way for agents to access semantic layer definitions. Through that governed layer, an assistant can query the metrics used by dashboards without requiring a separate SQL implementation or inventing its own definitions. MCP standardizes access rather than creating trustworthy metrics itself. Its value depends on the definitions and permissions behind the connection. For agent-first teams, the useful headless pattern is a backend that serves human interfaces and agents from that shared foundation.
A Supabase team seeking raw API access or usage analytics inside an agent needs governed datasets that can be consumed without a prebuilt dashboard UI. Reports, dashboards, and agent tools become consumers of the backend rather than competing places to encode business logic. Full API control and MCP access meet related needs, but both need the data to be modeled first.
Informatica announced native MCP support at Informatica World 2026 in Las Vegas, held May 19–21, 2026. Its May 20 announcement described it as the first enterprise data management platform to deliver fully headless data management, allowing agents to invoke data services with zero code. MCP servers launched across AWS, Microsoft Foundry, Databricks Agent Bricks, Snowflake Cortex AI, and Google Cloud, with native integration into Salesforce Agentforce. This enterprise data management example demonstrates the access pattern.
ZoomInfo’s GTM AI became generally available on June 1, 2026, as a headless, MCP-native context layer with no interface of its own. It grounds surfaces including Claude, ChatGPT, Microsoft Copilot, Salesforce Agentforce, and HubSpot Breeze in verified company data. That example concerns GTM context rather than Supabase usage analytics. Salesforce’s Headless 360 MCP Server, meanwhile, entered Beta in July 2026. Widespread enterprise case studies showing that this approach outperforms well-designed API integrations do not yet exist, so the pattern warrants prototyping but remains early for mission-critical use.
A practical decision framework for choosing between AI reports and dashboards
A team should establish whether everyone uses the same calculations for MRR, churn, and active users, whether an AI answer traces back to a canonical definition without analyst cleanup, and whether analytical queries are isolated from production. Any negative answer identifies an infrastructure gap to resolve first. For Supabase teams, a pre-modeled dataset exposed through governed access establishes the prerequisite for both formats without giving agents production credentials.
A static dashboard works well for stable metrics that teams check each day, especially when non-technical stakeholders need visuals they know and a consistent way to view the numbers. An AI-generated report works well for operational queries asked often, analysis of a specific scenario, and reports that only one manager or department needs. Delivery is another legitimate reason to choose it. Reports can push insights into an inbox or Slack when requiring people to revisit a dashboard would not fit the workflow.
A spreadsheet or lightweight visualization can handle requests that come up less often when automation would take more time to set up than it saves. The decision can change as recurrence and audience grow, without requiring the team to redefine its metrics each time. One governed data layer, rather than a patchwork of reporting tools, is how a small team and its agents stay aligned on a single set of numbers.